

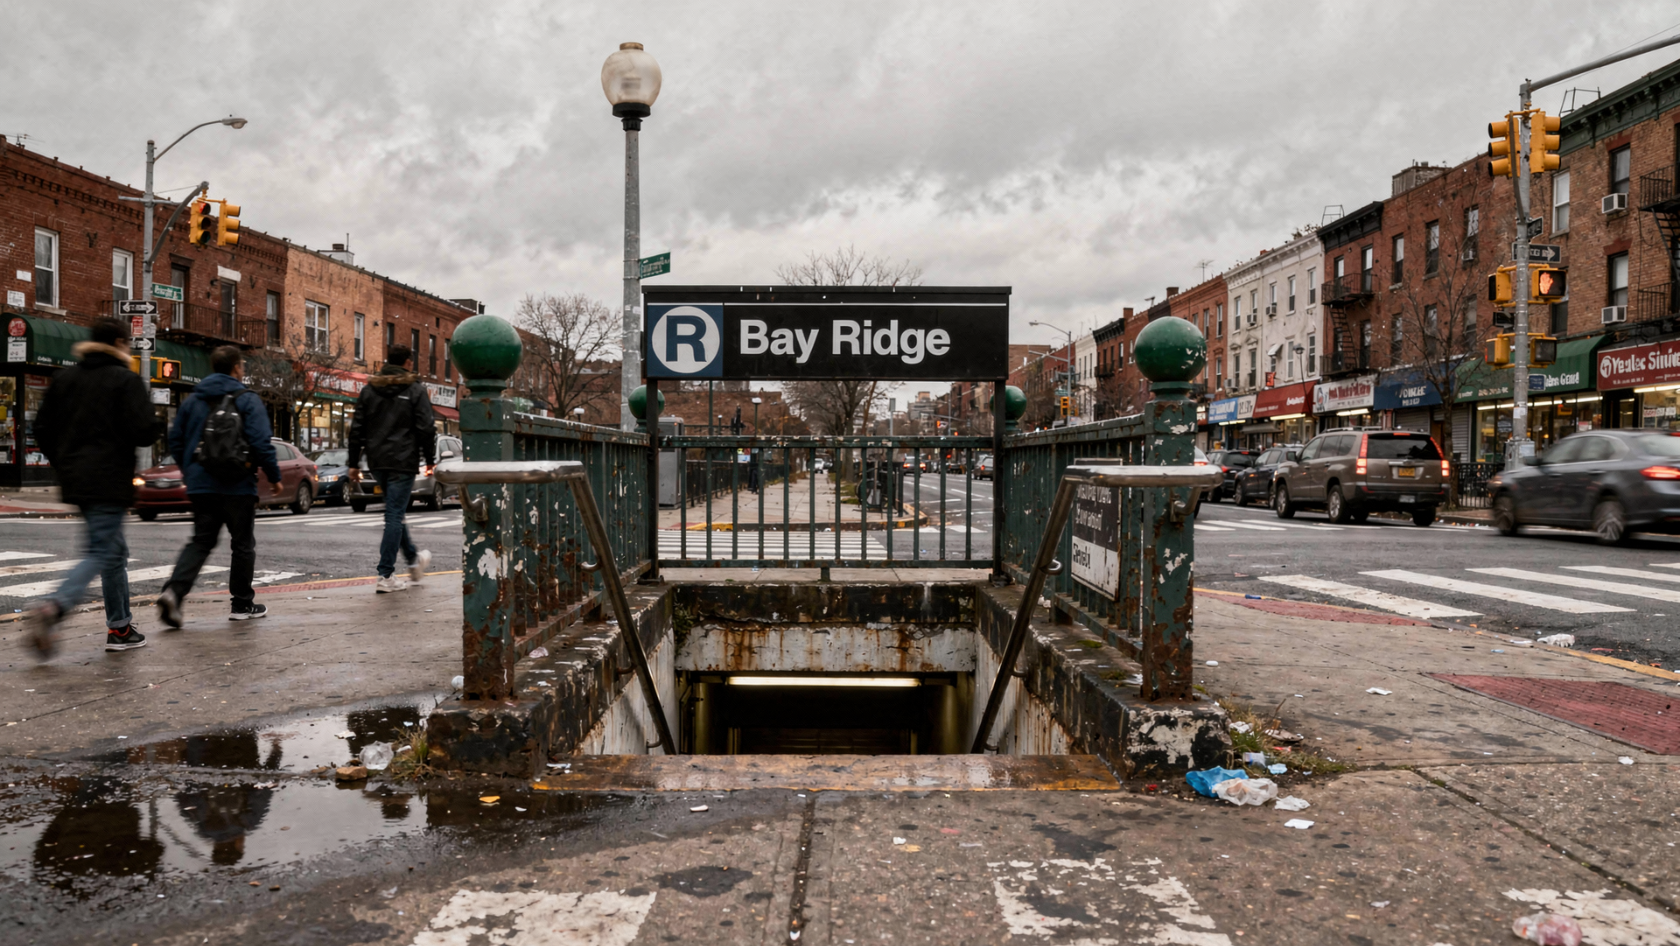
Walk through Bay Ridge on a Saturday afternoon and you'll notice something odd - packed open houses but hardly any new "For Sale" signs popping up on blocks where homes used to turn over regularly. The same pattern shows up in Dyker Heights and Bensonhurst, where buyers crowd into the few available properties while potential sellers stay put in homes they might have listed two years ago. This seller hesitation is tightening inventory, which keeps supporting prices for well-priced homes even when mortgage rates hit levels that should cool demand. The data tells a clear story - when fewer homeowners decide to sell, the remaining properties face stronger competition, and that competition translates into sustained pricing power for sellers who do make the move. This analysis focuses purely on market mechanics, not whether you should sell or wait, because understanding these forces helps you make better decisions regardless of your timeline. You'll discover the specific reasons your neighbors are holding off on selling, from interest rate concerns to the challenge of finding replacement homes within walking distance of family and familiar routines. More importantly, you'll learn how this seller behavior changes negotiating dynamics in your specific neighborhood and what early warning signals to watch for when market conditions start shifting. The goal is giving you the data-driven insights to interpret those busy open houses and quiet listing activity you're seeing firsthand, so you can time your own decisions around facts rather than headlines or pressure from either direction.
I notice that no source link or source content summary was provided in your request. The and sections are empty. Without this information, I cannot identify which text in the section should be linked or where it should link to.
Please provide the source link and source content summary so I can add the appropriate external link to relevant text in the section.
The three biggest reasons Brooklyn homeowners are staying put
Crowded open houses combined with minimal new inventory creates a puzzle that becomes clearer when you examine the specific financial and practical barriers keeping current homeowners from listing their properties. Three distinct forces are working together to reduce the number of homes hitting the market, each creating its own compelling reason to stay put rather than test the waters.
1) The rate lock-in effect
Homeowners who secured mortgages below 4% during the pandemic years face a stark mathematical reality when current rates hover in the low 6% range. Federal Housing Finance Agency research shows that "lock-in decreased the sales of homes with fixed-rate mortgages by 45% in 2024Q2" nationwide. A Bay Ridge family with a 3.2% mortgage on their colonial near Fort Hamilton High School would see their monthly payment jump by hundreds of dollars if they bought a similar home today, even if they sold for a profit. This payment shock keeps "For Sale" signs off lawns throughout neighborhoods where homeowners recognize that moving means sacrificing years of payment stability they've already achieved.
2) The replacement-home problem
Finding your current home was challenging enough, but locating the next one within your preferred radius adds layers of complexity that many homeowners simply avoid. A Dyker Heights family might love their tree-lined block's proximity to L&B Spumoni Gardens and the easy walk to the D train, but similar homes in the same school district appear rarely and get snapped up quickly when they do. Bensonhurst residents who've built routines around 86th Street shopping and specific bus routes to Manhattan discover that comparable properties in their comfort zone are either unavailable or priced beyond their trade-up budget. Rather than compromise on location factors that took years to appreciate, many choose to renovate or expand their current space instead of listing.
3) Market uncertainty and timing fatigue
Homeowners who've been monitoring rates and prices for months often reach a decision-making standstill, waiting for clearer signals about where the economy is headed. Brooklyn families watch mortgage rates fluctuate weekly while trying to predict whether home values in their neighborhood will continue climbing or level off. The mental energy required to track multiple moving variables while managing work and family responsibilities leads many to postpone major housing decisions until trends become more predictable. This wait-and-see approach removes potential listings from neighborhoods where buyers are actively searching.
Protecting your monthly budget and maintaining the lifestyle routines you've built around your current location represents rational decision-making, not fear or indecision. Your hesitation reflects careful consideration of two concrete assets - payment predictability that supports your family's financial planning and neighborhood stability that anchors your daily life.

How hesitation is shaping prices in Bay Ridge, Dyker Heights, and Bensonhurst
Limited inventory creates a mathematical advantage for sellers who do list their properties, as buyers face restricted options and must compete more aggressively for homes that match their criteria. This scarcity-driven dynamic supports pricing even when mortgage rates would typically cool buyer enthusiasm.
Properties that do reach the market in these neighborhoods often attract multiple interested parties within the first two weeks, with single-family and two-family homes generating the most intense competition. Days on market average 15-20 for well-maintained properties, compared to 30-45 days for similar homes in areas with more active listing activity. Buyers frequently submit offers above asking price or waive inspection contingencies to secure detached homes with private driveways and yard space. The competition intensifies around properties near quality schools or transportation hubs, where families recognize the long-term value of location advantages that justify stretching their budgets despite higher borrowing costs.
The specific factors driving this competitive environment vary by neighborhood, but each area demonstrates how reduced supply amplifies buyer urgency:
- Bay Ridge attracts buyers seeking community character and space - Shore Road Promenade access, Owl's Head Park proximity, and the neighborhood's suburban feel within city limits draw families who previously considered Manhattan or other boroughs. Remote work flexibility has expanded the buyer pool to include households that no longer need daily subway commutes, making Bay Ridge's R train connection sufficient rather than essential. The neighborhood's established identity and lower building density appeal to buyers willing to compete for the lifestyle benefits these properties provide.
- Scarcity forces buyers to compromise on secondary preferences - When only three suitable single-family homes appear monthly in their target area, buyers often accept higher prices, shorter inspection periods, or seller-favorable closing dates to secure properties that meet their primary requirements. Two-family homes with rental income potential create especially fierce bidding situations, as buyers calculate that rental revenue helps offset higher mortgage payments and justifies aggressive offers.
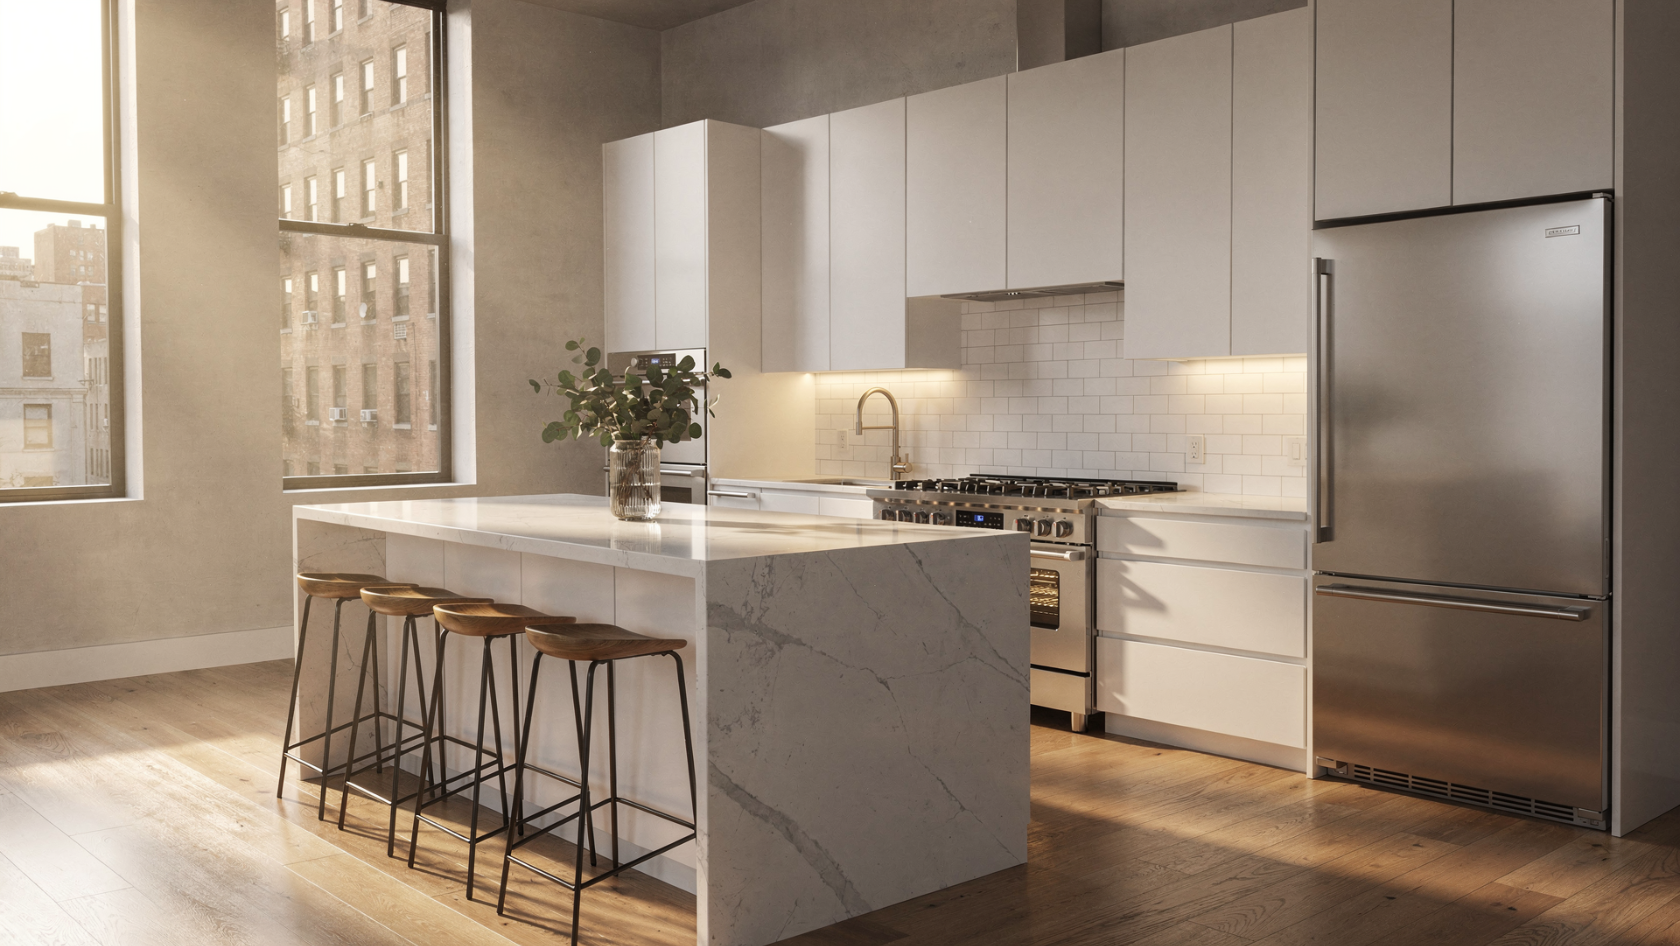
- Dyker Heights and Bensonhurst reveal a split market reality - Move-in ready homes with updated kitchens, functioning mechanicals, and cosmetic appeal command premium pricing and quick sales. Meanwhile, properties requiring significant renovation or estate sales with deferred maintenance face longer marketing periods and buyer requests for credits or price reductions. This two-tier system reflects buyer preferences for avoiding construction delays and permit complications in a high-rate environment.
- Accurate pricing determines competitive intensity - Buyers tolerate current interest rates when they find homes that align with their long-term housing goals, but they quickly abandon overpriced properties that don't justify the monthly payment increase. Homes priced 10-15% above comparable recent sales experience reduced showing activity and eventual price corrections, while properties priced at or slightly below market value often receive multiple offers within days.
Tracking these patterns reveals that competition remains selective rather than universal across all price points and property conditions. Turnkey homes priced competitively generate the strongest buyer response, while properties requiring work or carrying inflated price expectations face softer demand and extended marketing periods. The Brooklyn market demonstrates how historically low inventory creates these competitive dynamics across different neighborhood segments.
The street level factors that change demand block by block
Aggregate neighborhood data masks dramatic variations in buyer interest and pricing power that exist within just a few blocks of each other. A single zip code contains dozens of micro-markets where identical square footage commands different prices based on hyperlocal factors that influence daily routines and long-term value retention. Understanding these granular differences helps explain why some homes sell within days while others linger for months in the same statistical area.
Transit access creates a pricing "floor"
Homes within a three-block radius of R, D, N, F, or Q train stations maintain consistent buyer traffic regardless of broader market conditions or interest rate fluctuations. Properties near the 95th Street R station in Bay Ridge or the D train stops along 86th Street in Bensonhurst demonstrate this stability through sustained showing activity and faster offer timelines. Buyers recognize that subway proximity provides recession-proof value since transportation costs and commute reliability remain constant even when other economic factors shift.
The premium for rail access becomes more pronounced during periods of economic uncertainty, as buyers prioritize assets that retain desirability across different market cycles. A two-family home four blocks from the N train at 8th Avenue commands measurably higher per-square-foot pricing than comparable properties eight blocks away, with the difference often exceeding $50 per square foot in recent sales data. This gap widens when inventory tightens because buyers view subway-adjacent locations as safer long-term investments that justify stretching their budgets.
Property type creates separate micro-markets
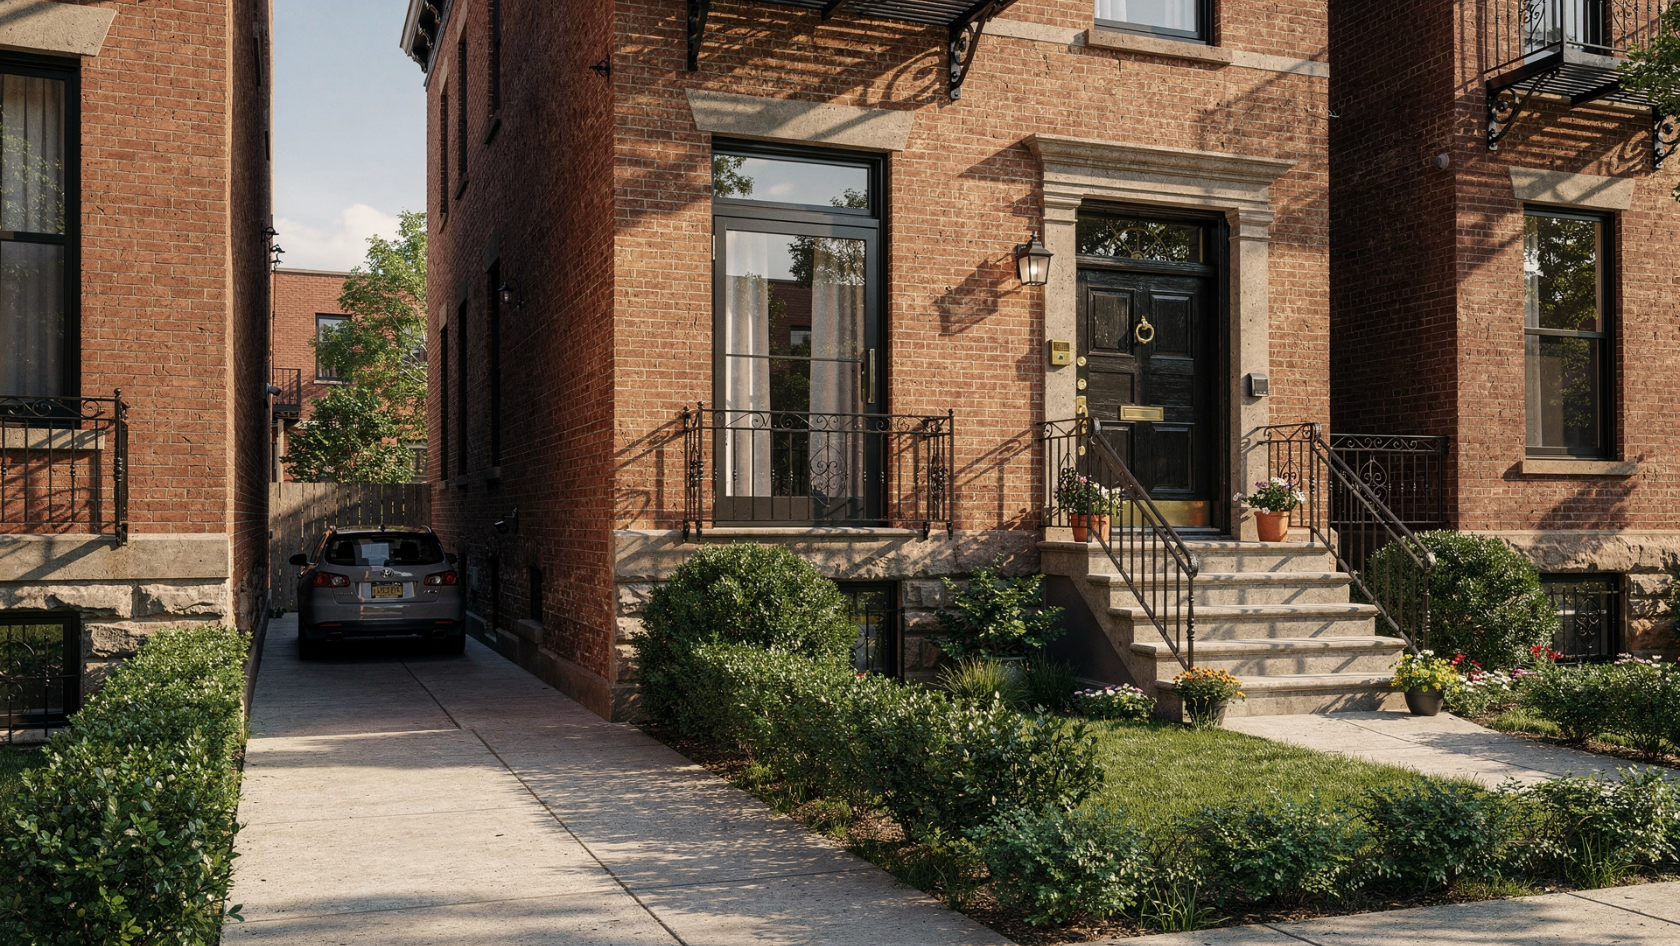
Single-family detached homes attract buyers seeking privacy, parking, and expansion potential, creating competition among families who prioritize space over rental income possibilities. These buyers typically secure conventional financing and focus on neighborhoods where zoning protects residential character, making them less price-sensitive when they find properties that match their lifestyle requirements. Their willingness to pay premiums for driveways, yards, and separation from neighbors drives per-square-foot values higher than attached housing options.
Two-family properties appeal to a different buyer segment that calculates rental income potential against mortgage payments and views these homes as investment vehicles first, residences second. This group often pursues portfolio lending or considers renovation loans to maximize rental yields, making them more analytical about purchase prices and renovation costs. Condominiums and cooperatives serve buyers who want homeownership without maintenance responsibilities, but these properties face financing restrictions and board approval processes that limit buyer pools and create different negotiation dynamics than fee-simple ownership structures.
Condition and update risk matters more than it used to
Buyers now factor contractor availability, permit processing delays, and material cost inflation into their purchase calculations more heavily than in previous market cycles. A kitchen renovation that might have cost $40,000 two years ago now approaches $60,000 with extended timelines, making turnkey homes significantly more attractive relative to fixer-uppers. Properties requiring major systems updates face buyer requests for substantial credits or price reductions that reflect not just renovation costs but also the carrying expenses during months-long construction periods.
Move-in ready homes with updated mechanicals, modern kitchens, and functioning bathrooms command premium pricing because they eliminate renovation uncertainty and allow immediate occupancy. Buyers calculate that paying extra for finished properties often costs less than purchasing cheaper homes that need work, especially when factoring in temporary housing expenses, permit fees, and project management time. This preference shift creates a two-tier market where cosmetic condition differences translate into disproportionate price gaps.

Lifestyle fit can outweigh square footage
Walking distance to quality schools, parks, and commercial corridors influences buyer decision-making more than raw interior space measurements. Families prioritize daily convenience factors like the ability to walk children to PS 176 or reach Leif Ericson Park without driving, viewing these lifestyle benefits as worth significant price premiums. The value buyers place on established routines and community connections often overrides concerns about slightly smaller room sizes or older building details.
Commercial strip proximity affects buyer enthusiasm measurably, with homes near 5th Avenue in Bay Ridge or 86th Street in Bensonhurst generating faster sales cycles than properties requiring car trips for basic errands. Buyers increasingly calculate the time and cost savings of walkable amenities into their housing budgets, making location convenience a quantifiable asset that supports higher pricing. This trend intensifies among remote workers who spend more time in their neighborhoods and value the ability to accomplish daily tasks on foot.
Evaluating these four variables simultaneously reveals why negotiating power shifts dramatically between properties that appear similar on paper but offer vastly different buyer experiences. Your home's specific combination of rail access, property type, condition, and lifestyle amenities determines which buyer segment will compete most aggressively for it, directly affecting both pricing strategy and timeline expectations.
I notice that no source link or source content summary has been provided in your request. The and sections are empty.
Without knowing what the source contains, I cannot identify relevant text to hyperlink that matches or relates to the source content.
Here is the original section unchanged:
What to watch if you are deciding whether to sell now or later
Five specific metrics function as your personal market dashboard for Bay Ridge, Dyker Heights, and Bensonhurst, revealing when conditions favor sellers without requiring you to predict interest rate movements or economic trends. These indicators measure actual buyer behavior and seller competition in your immediate area, giving you concrete data points to guide timing decisions based on local market dynamics rather than national headlines.
- Weekly inventory counts within your radius - Track how many single-family and two-family homes appear for sale each week within a 10-block radius of your property. When fewer than three comparable properties list monthly in your immediate area, buyer competition intensifies and supports stronger pricing for well-positioned homes. Conversely, when inventory jumps to eight or ten similar properties within walking distance, buyers gain negotiating leverage and can afford to be selective about condition, pricing, and terms.
- Speed of accepted offers and discount patterns - Monitor whether homes similar to yours receive accepted offers within 14 days versus lingering for 45-60 days on the market. Quick sales with minimal price reductions signal strong buyer demand and seller leverage, while extended marketing periods followed by 5-10% price cuts indicate buyers have more options and can wait for better deals. This metric reveals whether your property type currently commands premium pricing or faces buyer resistance.
- Above-asking-price sale frequency - Calculate what percentage of recently sold homes in your neighborhood closed above their original asking price, particularly for move-in-ready properties with updated systems and cosmetic appeal. When 40-50% of turnkey homes sell above ask, buyer competition remains fierce despite higher borrowing costs. When this percentage drops below 20%, buyers feel less pressure to submit aggressive offers and may request seller concessions instead.
- Contract signing momentum and buyer engagement - Watch for increases in accepted offer volume and showing activity even when mortgage rates remain elevated, as these patterns indicate buyer confidence is returning before rates actually decline. Rising contract activity suggests buyers are adapting to current financing costs and moving forward with purchases, creating more competition for available properties. This forward-looking indicator often predicts market strength 30-60 days before it becomes obvious in pricing data.
- Price gaps between ready-to-move and renovation-required properties - Measure the per-square-foot difference between homes needing significant updates versus those requiring minimal work in your specific area. When this spread widens beyond $75-100 per square foot, buyers are paying substantial premiums to avoid construction delays and contractor uncertainty. Narrowing gaps suggest buyers are becoming more willing to tackle renovation projects, potentially reducing demand for turnkey properties like yours.
Combining these five measurements every two to four weeks creates a comprehensive view of your local market's direction without relying on any single data point that might mislead your timing decision. Strong performance across multiple metrics suggests favorable selling conditions, while weakness in three or more areas indicates waiting might serve your financial goals better.
How to have a calm numbers first timing conversation
Removing emotion from housing decisions requires structuring your analysis around concrete financial data and household logistics rather than market predictions or neighborhood gossip. This systematic approach helps you identify the specific conditions that would make selling advantageous versus staying put, creating clear decision criteria based on your family's actual needs and resources.
Start with your household plan (not the market)
Your children's school enrollment, daily commute requirements, and proximity to family support systems establish the foundation for any housing decision before considering market conditions. A family with kids at PS 176 in Bay Ridge faces different constraints than empty nesters who no longer need walking distance to elementary schools but prioritize access to medical facilities and public transportation. Document your non-negotiable geographic boundaries, whether that means staying within the same school district, maintaining a specific commute time to Manhattan, or remaining close enough for grandparents to provide regular childcare support.
Cash reserves and timeline flexibility determine how much market volatility you can absorb during both selling and buying processes. Families with six months of expenses saved can weather extended marketing periods or temporary housing situations, while those operating with minimal reserves need predictable timelines and quick closings. Your employment stability, upcoming family changes, and major expense obligations create the guardrails within which any real estate transaction must fit, regardless of whether market conditions appear favorable or challenging.
Compare the mortgage you have vs. the mortgage you'd take on
Calculate your current monthly housing cost including principal, interest, property taxes, and homeowner's insurance, then determine what the same payment structure would look like on your target purchase price at current interest rates. A Bay Ridge homeowner with a $450,000 mortgage at 3.2% pays approximately $1,950 monthly before taxes and insurance, while a similar $650,000 mortgage at current rates around 6.5% would cost roughly $4,100 monthly. The Mortgage Bankers Association forecasts rates will average around 6.5% through 2026, meaning this payment differential may persist longer than many homeowners anticipate.
Payment shock analysis reveals whether your household budget can absorb the increased housing costs without compromising other financial goals or emergency reserves. Factor in the higher property taxes on a more expensive home, increased insurance costs, and any HOA or maintenance fees that don't exist in your current situation. This mathematical comparison often provides the clearest answer about timing, as families discover either that they can comfortably handle the payment increase or that waiting for rate improvements makes more financial sense than stretching their budget.
Build a realistic sell scenario (protecting your net)
Research comparable sales within three blocks of your property from the past 90 days to establish a probable price range, focusing on homes with similar square footage, condition, and lot characteristics rather than aspirational pricing from different neighborhoods. Factor in standard selling costs including broker commissions, attorney fees, staging expenses, and any repairs or improvements needed to achieve your target price range. Calculate your net proceeds after paying off your existing mortgage and all transaction costs to understand exactly how much capital you'll have available for your next purchase.
Develop a preparation timeline that addresses necessary repairs and cosmetic updates without over-improving for your neighborhood's price ceiling. A Dyker Heights colonial might benefit from fresh paint and updated fixtures, but installing a $40,000 kitchen renovation rarely returns full value in a neighborhood where comparable homes sell for $750,000 to $850,000. Plan for 30-45 days of preparation work followed by 15-25 days of active marketing based on recent absorption rates for similar properties in your immediate area.
Build a realistic buy scenario (inventory + non-negotiables)
Survey current inventory in your target neighborhoods and price range to understand what compromises you'll face in the replacement home process. If only two single-family homes under $900,000 are currently available in your preferred Bay Ridge radius, acknowledge that you may need to expand your search area, increase your budget, or accept different property characteristics than your current home offers. Document which features represent absolute requirements versus nice-to-have amenities, creating a clear framework for evaluating available properties.
Identify your deal-breakers and acceptable trade-offs before beginning your search to avoid emotional decision-making during competitive bidding situations. A family might accept a smaller yard or older kitchen to secure proximity to the R train, while another household prioritizes parking and storage space over walking distance to commercial strips. This pre-defined criteria helps you move quickly when suitable properties appear and prevents overextending your budget for features that don't align with your core priorities.
End with three decision options you can live with
Structure your final analysis around three distinct scenarios that each make financial and practical sense given your household situation. Option one involves selling within the next 90 days at current market conditions, accepting the payment increase and available inventory as reasonable trade-offs for achieving your housing goals now. Option two establishes specific trigger points for future action, such as waiting until mortgage rates drop below 6% or until inventory in your target area increases to five or more suitable properties monthly.
Option three tests the market with a defined pricing strategy and timeline, listing your home at the top of your researched range for 30 days to gauge buyer response, then adjusting price or removing the listing based on actual market feedback rather than speculation. Each scenario requires different preparation levels and financial commitments, but all three provide clear action steps that remove guesswork from your timing decision.
Developing these three pathways creates a framework for monitoring market conditions and personal circumstances without constantly second-guessing your approach or getting paralyzed by conflicting information from various sources.

Final Thoughts
The data shows a clear pattern - when Brooklyn homeowners hesitate to sell due to higher interest rates and replacement home challenges, listings drop and competition stays strong for well-priced properties in South and Southwest Brooklyn. This simple chain reaction explains why neighborhoods like Bay Ridge, Dyker Heights, and Bensonhurst maintain steady buyer interest despite broader market concerns.
Brooklyn operates as many micro markets rather than one unified system. Your block's condition, transit access, and property type matter more than borough-wide headlines or general real estate news. A two-family home near the R train in Bay Ridge faces different market forces than a condo in Bensonhurst or a single-family house in Dyker Heights.
This information helps you cut through market noise and focus on what actually affects your property value. Instead of reacting to general news stories, watch local signals - new listings in your immediate area, how long homes stay on the market, price reductions, and sales that close above asking price. These numbers tell the real story of your micro market.
Understanding these patterns puts you in control of your timing decision. You can spot when conditions shift in your favor and recognize when waiting might serve your goals better. The key is having accurate data for your specific block and property type.
Ready to see what the numbers say about your street? Let's schedule a private, data-focused conversation about timing that fits your household plans. No pressure, just facts tailored to your goals and your corner of Brooklyn.
—
Joseph Ranola | Five-Star Staten Island & South Brooklyn Realtor® (60+ Google reviews)
Associate Broker · Real Broker | Team Leader · Bridge & Boro Team
Serving 103xx and 11209 / 11214 / 11228 | $30M+ closed volume
📞 917-716-1496 | ranolarealestate.com
Check out this article next